
Unlock Odoo Insights: Build Your Custom Dashboard!
Discover the power of Odoo dashboards and learn how to create custom views to make better business decisions.

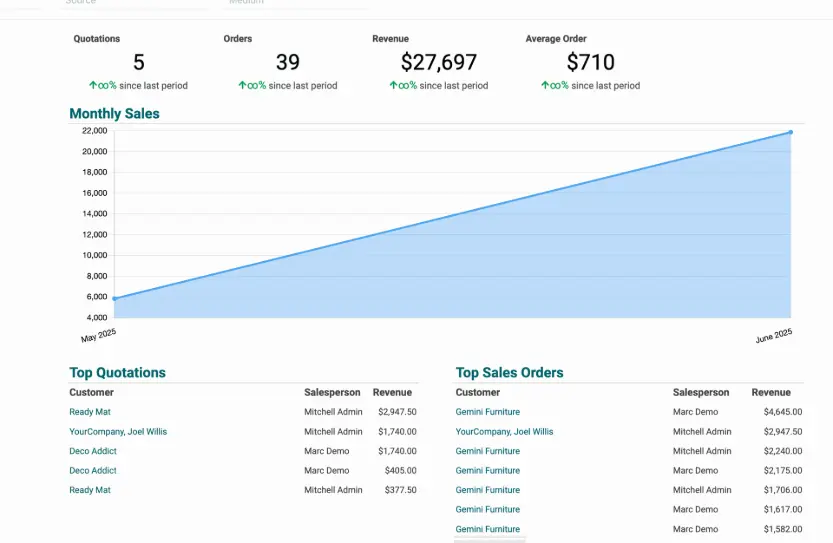
A well-designed Odoo dashboard can transform your business insights.
Why Odoo Dashboards Matter
ODOO brings all of your data together, and one of the best ways to showcase and leverage that data is with a dashboard. The team at ODOO has built out a lot of these for you already, but if you want to create your own or want to customize an existing one, you've come to the right place!
Odoo dashboards are more than just pretty charts; they're powerful tools that can significantly impact your bottom line. They provide a high-level overview of your business, allowing you to:
- Make Data-Driven Decisions: Access key performance indicators (KPIs) at a glance.
- Identify Trends: Spot patterns and anomalies in your data to anticipate future challenges and opportunities.
- Improve Efficiency: Focus on the metrics that matter most and streamline your operations.
- Boost Sales Performance: Track sales team progress and identify top performers.
In short, a well-crafted Odoo dashboard can be the difference between a million-dollar company and a ten-million-dollar company.
Building Your First Odoo Dashboard: A Step-by-Step Guide
Let's dive into building a custom sales dashboard in Odoo. We'll cover creating leaderboards for sales teams and individual salespeople, along with scorecards that can be filtered for targeted insights.
Step 1: Sales Team Leaderboard
First, we will create a leaderboard for our sales teams:
- Remove Existing Filters: Clear any existing filters in your Sales application.
- Group by Sales Team: Group your sales data by the "Sales Team" field.
- Insert into Spreadsheet: Create a new, blank spreadsheet and insert the grouped data.
Now, let's start constructing our dashboard by creating a list of the Top 10 Sales Teams in order.
- Open the Odoo Sales Dashboard From Configuration > Dashboards
- Enter Edit Mode.
- Go to Spreadsheet View From the smart button
- Create Spreadsheet Structure: Mimic the existing dashboard structure by creating a "Dashboard" sheet and a "Data" sheet. Rename the sheets accordingly.
- Add Headers: In the “Dashboard” sheet, create headers for “Top 10 Sales Teams,” “Team Name,” and “Sales Amount.”
- Insert Pivot Cell for Team Name: Go to Insert > Insert Pivot Cell. Point it to the Pivot Table you just created.
- Insert Pivot Cell for Sales Amount: Go to Insert > Insert Pivot Cell. Point it to the Pivot Table you just created.
Important Note: Sort your pivot tables *before* inserting them into the spreadsheet. Sorting cannot be easily changed afterward. To sort, click the list menu in the pivot view and arrange your categories (salesperson, sales team, etc) by a measure (total, count, etc)
Step 2: Sales Person Leaderboard
Building a salesperson leaderboard will feel very familiar to you after creating a sales team dashboard. Follow the same steps, but remember to group by salesperson instead of sales team!
Step 3: Sales Scorecard
Let's generate some key metrics:
- Number of orders
- Revenue
- Average order value
- Data Tab: In the Data tab, set up cells for “Total Sales Amount”, “Total Count of Sales”, and “Average Sale Amount”
- Insert Pivot Cells: For “Total Sales Amount” and “Total Count of Sales”, use insert pivot cell to calculate those values based on the right pivot tables
- Calculate Averages: create a final cell that averages sales to provide an average order value
- Insert Chart: In the dashboard tab, select “Insert > Chart” and choose a scorecard type chart.
Step 4: Adding Filters
The final step in configuring a dashboard is to add filters to allow the end users to narrow the data to find the insights they need!
- Configuration > Dashboards > Open the Sales Dashboard> Enter Edit Mode
- Add relational filters: Add filters for “Sales Team” and “Salesperson”, making sure to pick the correct, related models and fields.
- Add Period filter: add a filter for the period (month, quarter, year). Make sure to select “Order Date” as your date field
Once you've added the filter, be sure to save and publish the dashboard to make it available to all your users.
Conclusion
With these steps, you can unlock the power of Odoo dashboards and gain valuable insights into your business. Remember to experiment with different metrics, filters, and visualizations to create a dashboard that truly meets your needs. If you have any questions, drop them in the comments below!